
In case you missed it, a couple of weeks ago the media was abuzz with reports that a new Johns Hopkins Medicine research study had “proved” that the primary cause of cancer was bad luck—not diet, not environment, not unhealthy habits. As the media presented it, someone who smokes can easily live until 90, whereas the abstemious puritan is just as likely to die of cancer at the age of 50. As the media interpreted the study, bad habits matter, but not very much—and only for some cancers. On the other hand, good diets and clean living don’t make much of a difference. In fact, as the press reported the study, roughly two-thirds of cancers in adults can be attributed to random mutations in genes capable of driving cancer growth. The headlines tell it all.
- Most cancer types ‘just bad luck’1 James Gallagher. “Most cancer types ‘just bad luck'” BBC News 2 January 2015. (Accessed 10 Jan 2015.) http://www.bbc.com/news/health-30641833
- Cancer: It Sure Ain’t Good Luck2 Bill Couzens. “Cancer: It Sure Ain’t Good Luck.” Huffpost 01/08/2015 (Accessed 10 Jan 2015.) http://www.huffingtonpost.com/bill-couzens/cancer-it-sure-aint-good-_b_6433518.html
- Unlucky Random Mutations Responsible for Cancer3 Pentago. “Unlucky Random Mutations Responsible for Cancer.” cleveland.com. January 08, 2015. (Accessed 10 Jan 2015.) http://blog.cleveland.com/regular-joe/2015/01/unlucky_random_mutations_respo.html
- Study concludes that many cancers caused by bad luck in cell division4 Jeanne Whalen. “Study concludes that many cancers caused by bad luck in cell division.” Fox News. January 02, 2015. (Accessed 10 Jan 2015.) http://www.foxnews.com/health/2015/01/02/study-concludes-that-many-cancers-caused-by-bad-luck-in-cell-division/
- Scientists: Random gene mutations primary cause of most cancer5 Ben Brumfield. “Scientists: Random gene mutations primary cause of most cancer.” CNN January 3, 2015. (Accessed 10 Jan 2015.) http://www.cnn.com/2015/01/02/health/cancer-random-mutation/
There’s no question that if these headlines are true and can be taken at face value, this truly would be revolutionary, and, as the researchers themselves said, will change the way people think about cancer and its risk factors—not to mention potentially causing a seismic shift in which future studies are funded.
However, as with most things concerning health that the mainstream media gets its hands on, things are seldom as simple as presented—or as Gilbert and Sullivan said, “Things are seldom what they seem.” It’s also worth keeping in mind that headlines in the mainstream media are conceived more for their shock value than for scientific accuracy. We’ll cover this more in detail, but let me give you a teaser. While it’s true that the study’s authors concluded that some two-thirds of the cancers they looked at can be attributed to random mutations in genes capable of driving cancer growth, that doesn’t mean what you probably think it means—and it certainly doesn’t mean what most news stories said it means.
But first, let’s take a detailed look at the study in question.
The Study
The two and a half page study was published in the January 2nd issue of Science magazine.6 Cristian Tomasetti1, Bert Vogelstein, “Variation in cancer risk among tissues can be explained by the number of stem cell divisions.” Science 2 January 2015: Vol. 347 no. 6217 pp. 78-81. http://www.sciencemag.org/content/347/6217/78.abstract The question the study was trying to answer was: why do some tissues give rise to cancer in humans a million times more frequently than others? The reigning hypothesis is that most cancers are primarily due to mutations which are either inherited or caused by environmental exposures, such as smoking or certain viruses.
The researchers’ conclusion, however, was that these differences can be explained by the number of stem cell divisions involved in each type of tissue. By plotting the lifetime incidence of various cancers against the estimated number of normal stem cell divisions in the corresponding tissues over a lifetime, they found a strong correlation extending over five orders of magnitude. This suggests that random errors occurring during DNA replication in normal stem cells are the major contributing factor in cancer development. According to the researchers, “Remarkably, this ‘bad luck’ component explains a far greater number of cancers than do hereditary and environmental factors.” But keep in mind, what the researchers are talking about here is the variation in cancer risk between “different types” of cancer, not your “absolute risk” of coming down with cancer as the media would have you believe. (This distinction is a HUGE deal when talking about the study, and we’ll explore it in some detail a bit later.)
As just mentioned, the question that drove the study was the observation that the frequency at which cancer occurs in different tissues throughout the body varies dramatically—up to a million times more frequently in some tissues as opposed to others. One particular example the study cites is cancer in the intestinal tract. Cancer occurs 24 times more often in the large intestine than the small intestine. And, as stated in the study’s premise, the difference between the occurrence of cancer in the most and least prone tissue is one million times. As the researchers stated, such differences can’t be explained by differences in exposure to carcinogenic substances, hereditary factors, or even random mutations in cells when they divide. Instead, the researchers theorized that the key to cancer lies in stem cells, which are much longer-lived than the majority of cells making up an organ. The researchers proposed that it is the mutations in stem cells that are most likely to contribute to cancer. And If this were true, then the number of stem cell divisions in a particular tissue over a human lifetime would absolutely correlate with the lifetime risk of developing cancer in that organ.
Testing their theory became a simple matter of gathering data from previous research and looking for that correlation. Keep in mind, this is not a double blind study; it is not a research study; it is not a metastudy. Instead, it is a mathematical analysis of existing data. The researchers, Vogelstein and Tomasetti, have put forth a mathematical analysis of the genesis of cancer that suggests many cases are not preventable. Drawing on the published literature, they estimated the number of cells in 31 different types of tissue, what percentage of them are long-lived stem cells, and how many times the stem cells divide. With every division, there’s a risk of a cancer-causing mutation in a daughter cell. They reasoned that the tissues that host the greatest number of stem cell divisions are those most vulnerable to cancer. When they crunched the numbers and plotted against data on cancer incidence in the U.S., the authors found a surprisingly strong correlation (r = 0.81): as the number of stem cell divisions increased, so did the frequency of a particular cancer.
The researchers then multiplied the number of stem cell divisions by the lifetime risk associated with getting that particular type of cancer to establish its “extra risk score” (ERS). Finally, they ranked each type of cancer according to its ERS score. Roughly one-third of cancer types examined showed positive ERSs (blue bars), and two-thirds showed negative ERSs (green bars).
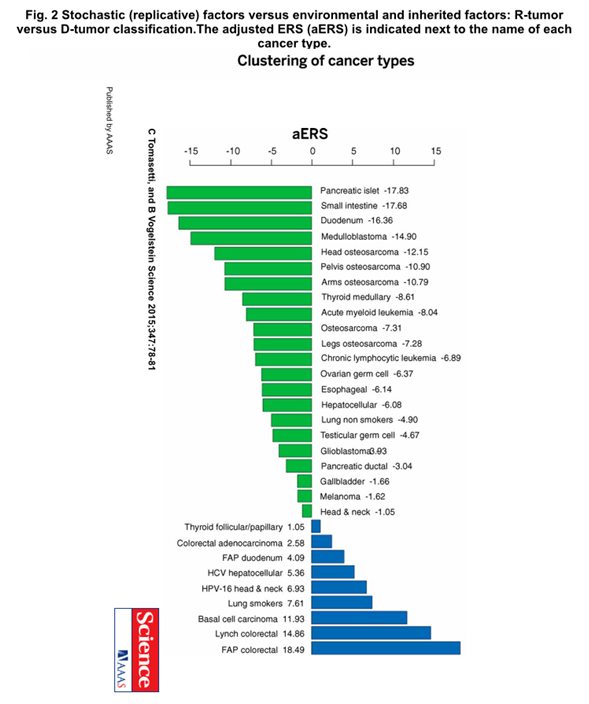
For the most part, the blue bars represent cancers for which strong hereditary or environmental risk factors have been identified, such as familial adenomatous polyposis (FAP) colorectal cancer (a rare form of inherited cancer), lung cancer (associated with smoking), skin/basal cell cancer (associated with sun exposure), and liver/hepatocellular cancer (associated with hepatitis C).
But as you can see, the blue bar cancers represent only about one third of the cancer types tested. The majority of cancers (two-thirds) are due to “bad luck,” that is, random mutations arising during DNA replication in normal, noncancerous stem cells. Those are the cancer types shown in green. Again, only one third of cancers have strong connection to lifestyle or environment. As presented by the media, changing your environment or lifestyle will only be helpful in preventing these particular cancers. But again, according to the study, these represent only one third of all cancers. Two thirds of all cancers are independent of these factors and are simply the result of “bad luck.” They are not preventable. For the majority of cancers, then, your best bet is early detection.
The problem is, that’s not entirely accurate.
Driving a Truck through the Holes
Let me be clear. I don’t have a problem with the premise of the study. I’ve pretty much said the same thing myself for the last quarter century. Everybody, every day of their lives, produces aberrant cells in their body as a result of normal metabolic processes and cell division—anywhere from a few hundred to as many as 10,000 such cells a day. In a healthy body, your immune system identifies each and every one of those cells and eliminates them all. Cancer “occurs” when your immune system fails to do its job and one of those cells takes root and begins to multiply.
I also don’t have a problem with the data collected. Simple observation tells you that some types of cancer are more prevalent than others. And I don’t even have a problem with the analysis of that data—that two thirds of all the different types of cancer are directly tied to the rate of stem cell division. if you think about it, it only makes sense. If aberrant cells appear when cells divide, the more cell divisions you have in a particular organ, the more likely you are to produce aberrant cells. It’s simple math. It’s also one of the reasons that your chances of getting cancer go up as you age—the older you are, the more times your cells have divided.
And for that matter, I don’t really have a problem with the analysis of the data: that two thirds of all the cancer types looked at appear to be strictly tied to the rate of cell division, not environmental, lifestyle, or heredity. But here’s the key: what we’re talking about here—and the study’s authors make clear they understand the distinction–is the variation in cancer risk between different types of cancer, not your absolute cancer risk of coming down with cancer. Unfortunately, when presenting their analysis, the study’s authors cast that distinction aside and encouraged people to believe they were talking about absolute risk.
What does that mean? What is the difference between “variation” and “absolute” cancer risk? Isn’t two thirds two thirds? That’s what the media would have you believe.
 To understand what we’re talking about here, look at the table above. Understand, that for the purposes of their study—determining which cancers are the result of bad luck–osteosarcoma and lung cancer carry equal weight. They are each represented by one bar and one position on the graph. But in real life, there are only about 800 new cases of osteosarcoma diagnosed in the U.S. each year7 “What are the key statistics about osteosarcoma?” ACS Jan 6, 2015. (Accessed 12 Jan 2015.) http://www.cancer.org/cancer/osteosarcoma/detailedguide/osteosarcoma-key-statistics versus about 250,000 lung cancer cases.8 “What are the key statistics about lung cancer?” ACS 12/12/2014. (Accessed 12 Jan 2015.) http://www.cancer.org/cancer/lungcancer-non-smallcell/detailedguide/non-small-cell-lung-cancer-key-statistics When you’re talking about cancer types, one line/one bar is appropriate; but when you’re talking about absolute cancer risk, your graph would need 312 bars to represent lung cancer versus one bar for osteosarcoma (250,000 divided by 800). And for that matter you will see colorectal cancer and thyroid cancer in the blue bar section of the graph. These also are hugely prevalent cancers with cases numbering in the tens of thousands each year. They too would require many, many bars if you were representing absolute risk. If we were looking at absolute risk blue bar cancers—the cancers that are influenced by environment and lifestyle—that section would be many times larger than the green section. And it should be noted that common cancers that are likely connected to environment and lifestyle, including breast, cervical, endometrial, prostate, bladder, and kidney cancer, didn’t get listed because reliable stem cell data were not available for these types. They too would likely be represented by multiple blue bars. Now, instead of seeing two thirds of cancers in the “bad luck” section, we’re probably looking at 80% of the actual cancers that you are likely to get now sitting in the lifestyle, environment, and heredity section.
To put it simply, the most common cancers are either listed as being affected by lifestyle and environment, or didn’t get listed at all. That’s kind of a big deal. And it’s even worse than it sounds.
For example, let’s take a closer look at what the study has to say about cancer in smokers. If you read the study, you would see that it lists the lung cancer risk as 18 times higher for smokers than non-smokers who get cancer. But the study doesn’t actually segment out smokers from the U.S. population as a whole in its analysis. Its evaluation is based on the entire U.S. population when in fact only about 18 percent of the population still smokes.9 “Adult Cigarette Smoking in the United States: Current Estimates.” CDC February 14, 2014 (Accessed 12 Jan 2015.) http://www.cdc.gov/tobacco/data_statistics/fact_sheets/adult_data/cig_smoking/ That dilutes the actual risk factor associated with smoking. To determine the real risk from smoking, you would have to multiply the extra risk due to smoking by the proportion of the population that actually smokes and divide it by the total lung cancer risk. When you do that, you see that about 75% of your risk of getting lung cancer is due to smoking. And when you consider that lung cancer accounts for about a quarter of a million cases of cancer every year, it literally turns the concept that two thirds of all cancers are due to bad luck on its head. For more on the statistical distortions found in the way the media is presenting the study, check out this article from theguardian.10 Bob O’Hara and GrrlScientist. “Bad luck, bad journalism and cancer rates.” theguardian. 2 January 2015 (Accessed 12 Jan 2015.) http://www.theguardian.com/science/grrlscientist/2015/jan/02/bad-luck-bad-journalism-and-cancer-rates
And then there are the questions that hang over the study. For example:
If pancreatic cancer is so solidly in the green “bad luck” camp, then why has its incidence increased so dramatically over the last century—well above rates that might be expected by the increase in the senior citizen population?11 Stephens FO. “The increased incidence of cancer of the pancreas: is there a missing dietary factor? Can it be reversed?” Aust N Z J Surg. 1999 May;69(5):331-5. http://www.ncbi.nlm.nih.gov/pubmed/10353546 In fact, moving forward, pancreas and liver cancers are projected to surpass breast, prostate, and colorectal cancers to become the second and third leading causes of cancer-related death by 2030.12 Lola Rahib, Benjamin D. Smith, Rhonda Aizenberg, et al. “Projecting Cancer Incidence and Deaths to 2030: The Unexpected Burden of Thyroid, Liver, and Pancreas Cancers in the United States.” AACR May 19, 2014 That can’t happen if the incidence of pancreatic cancer is mostly determined by mathematical bad luck. In fact, what it says is that despite its placement in the green camp, some external factor is dramatically driving up the incidence of pancreatic cancer.
Why does liver (hepatocellular) cancer appear in the “bad luck” camp, when we already know it’s strongly associated with cirrhosis, fatty liver disease, and the hepatitis B virus infection? The math doesn’t add up.
If these numbers are set in mathematical stone, then why does the incidence of cancer vary so dramatically between geographical regions? Some cancers are more common in people in the developed world (for example, breast and prostate), others occur more frequently in people who live in developing countries (cervical and stomach).
And why is it that migration patterns show that the incidence of cancer among migrants changes to more closely reflect the rates in the adoptive country. This has been observed with the incidence of colon cancer in Japanese people emigrating to Hawaii and San Francisco.13 Dunn, J. E. “Cancer epidemiology in populations of the United States — with emphasis on Hawaii and California — and Japan.” Cancer Res. 35, 3240-3245 (1975). http://cancerres.aacrjournals.org/content/35/11_Part_2/3240.long Additionally, the incidence of prostate and breast cancers are low among Chinese people in Asia, but increases have been observed when these people move to the U.S.14 Yu, H., Harris, R. E., Gao, Y. T., Gao, R. & Wynder, E. L. “Comparative epidemiology of cancers of the colon, rectum, prostate and breast in Shanghai, China versus the United States.” Int. J. Epidemiol. 20, 76-81 (1991). http://www.ncbi.nlm.nih.gov/pubmed/2066247 Does that make them green or blue?
Conclusion
The bottom line is that, as usual, the headlines got it wrong; they promote a finding that the study in question didn’t actually come up with. However, in this particular case, the media isn’t entirely to blame. The researchers, although they clearly identify in their study that their numbers refer to variations in types of cancer and not to the absolute number of cancer cases, they kind of drop that distinction in their presentation of their results. A number of talking head doctors in presenting their observations of the study to the media reinforced that misrepresentation. Then again, most doctors aren’t trained statisticians. As Benjamin Disraeli was reportedly fond of saying, “There are three kinds of lies in the world: lies, damn lies, and statistics.” Let’s just say that the reports in the mainstream media about this study would make him smile.
 Quite simply, although two thirds of all types of cancer may indeed be driven primarily by bad luck, when you look at the statistic that truly matters, the number of absolute cancer cases, those numbers are flipped upside down. And when you add in the cancers that were not listed, but are among the most prevalent—prostate and breast cancer, for example—and that we know are driven by outside factors, the conclusions presented in the media look even more out of sync with reality. Breast cancer, for example, is notably driven by genetics, estrogen dominance, exposure to xenoestrogens and pesticides. And prostate cancer is driven to a large degree by high levels of estrogen, exposure to xenoestrogen, and the excessive conversion of testosterone to DHT.
It’s also worth noting that since the study took its data from pre-existing studies involving the whole US population, then an overwhelming percentage of the people involved would be eating the modern American diet, have high levels of xenoestrogens and other toxins in their bodies, and have severely compromised immune systems as they age. In other words, the statistical mean for the study is being set by people who are, by definition, already compromised by diet and lifestyle. There is virtually no data in the study to truly establish the difference between bad luck and externally compromised since almost everyone included in the data is compromised.
And most important of all, it must be remembered that all we’re talking about at this point is the appearance of a single cancerous cell that starts the process leading to full blown cancer. This study does nothing to factor in how your body’s defense mechanisms deal with that aberrant cell. If your defenses are strong, your body knows how to detect that cell and eliminate it from your body before it ever has a chance to take root. In other words, even in those cases where the appearance of the original seed cancer cell is driven by bad luck, whether or not it takes root and becomes a problem is largely driven by environment, lifestyle, and your personal baseline of health.
References
| ↑1 | James Gallagher. “Most cancer types ‘just bad luck'” BBC News 2 January 2015. (Accessed 10 Jan 2015.) http://www.bbc.com/news/health-30641833 |
|---|---|
| ↑2 | Bill Couzens. “Cancer: It Sure Ain’t Good Luck.” Huffpost 01/08/2015 (Accessed 10 Jan 2015.) http://www.huffingtonpost.com/bill-couzens/cancer-it-sure-aint-good-_b_6433518.html |
| ↑3 | Pentago. “Unlucky Random Mutations Responsible for Cancer.” cleveland.com. January 08, 2015. (Accessed 10 Jan 2015.) http://blog.cleveland.com/regular-joe/2015/01/unlucky_random_mutations_respo.html |
| ↑4 | Jeanne Whalen. “Study concludes that many cancers caused by bad luck in cell division.” Fox News. January 02, 2015. (Accessed 10 Jan 2015.) http://www.foxnews.com/health/2015/01/02/study-concludes-that-many-cancers-caused-by-bad-luck-in-cell-division/ |
| ↑5 | Ben Brumfield. “Scientists: Random gene mutations primary cause of most cancer.” CNN January 3, 2015. (Accessed 10 Jan 2015.) http://www.cnn.com/2015/01/02/health/cancer-random-mutation/ |
| ↑6 | Cristian Tomasetti1, Bert Vogelstein, “Variation in cancer risk among tissues can be explained by the number of stem cell divisions.” Science 2 January 2015: Vol. 347 no. 6217 pp. 78-81. http://www.sciencemag.org/content/347/6217/78.abstract |
| ↑7 | “What are the key statistics about osteosarcoma?” ACS Jan 6, 2015. (Accessed 12 Jan 2015.) http://www.cancer.org/cancer/osteosarcoma/detailedguide/osteosarcoma-key-statistics |
| ↑8 | “What are the key statistics about lung cancer?” ACS 12/12/2014. (Accessed 12 Jan 2015.) http://www.cancer.org/cancer/lungcancer-non-smallcell/detailedguide/non-small-cell-lung-cancer-key-statistics |
| ↑9 | “Adult Cigarette Smoking in the United States: Current Estimates.” CDC February 14, 2014 (Accessed 12 Jan 2015.) http://www.cdc.gov/tobacco/data_statistics/fact_sheets/adult_data/cig_smoking/ |
| ↑10 | Bob O’Hara and GrrlScientist. “Bad luck, bad journalism and cancer rates.” theguardian. 2 January 2015 (Accessed 12 Jan 2015.) http://www.theguardian.com/science/grrlscientist/2015/jan/02/bad-luck-bad-journalism-and-cancer-rates |
| ↑11 | Stephens FO. “The increased incidence of cancer of the pancreas: is there a missing dietary factor? Can it be reversed?” Aust N Z J Surg. 1999 May;69(5):331-5. http://www.ncbi.nlm.nih.gov/pubmed/10353546 |
| ↑12 | Lola Rahib, Benjamin D. Smith, Rhonda Aizenberg, et al. “Projecting Cancer Incidence and Deaths to 2030: The Unexpected Burden of Thyroid, Liver, and Pancreas Cancers in the United States.” AACR May 19, 2014 |
| ↑13 | Dunn, J. E. “Cancer epidemiology in populations of the United States — with emphasis on Hawaii and California — and Japan.” Cancer Res. 35, 3240-3245 (1975). http://cancerres.aacrjournals.org/content/35/11_Part_2/3240.long |
| ↑14 | Yu, H., Harris, R. E., Gao, Y. T., Gao, R. & Wynder, E. L. “Comparative epidemiology of cancers of the colon, rectum, prostate and breast in Shanghai, China versus the United States.” Int. J. Epidemiol. 20, 76-81 (1991). http://www.ncbi.nlm.nih.gov/pubmed/2066247 |


Excellent rebuttal, John.
Excellent rebuttal, John. Thank you.
If Cancer is bad luck, why
If Cancer is bad luck, why has our luck change so much over the years. Going from almost no cancer in the early 1900 to an epidemic today. Sounds like that story is another one from big pharma which does not want any cures.
I agree–this is a solid
I agree–this is a solid analysis of the flaws in the presentation of the study’s findings and these researchers have to be well aware how their report will be used to misguide the public.
This article is dog poop –
This article is dog poop – sorry, but it is. Years ago I worked for oncologists and they knew everything about cancer from cause, cure, and prevention in the first place. All of this came from a very elegant concept known as the ‘Free Radical Theory of Cancer’. Google it, but over the years this info has been getting sanitized – bad for people to know the truth – hurts medical industry profits. Bottom line is this: take plenty of anti-oxidant supplements and minerals, and get full body sun (A.K.A. vitamin D).
@mendocino
@mendocino Please clarify “This article is dog poop……:”
What Article? Do you mean Jon’s article or the study?
I think the study is a waste of money.
So true.
So true. While reading the first part of the article, I thought “ok the difference MIGHT be due to the errors in DNA replication of the stem cells”. But HOW do we know that environmental factors do NOT have an impact on these? We don’t and I suspect there is a very important reason for this: environment (internal and external) does have a major impact on this.
Then Dr Barron arrived at a simliar (but better written) argument about the data being collected mostly in the US and mostly from people who systems are already “compromised”. Of course!.
So really the researchers who authored the study have done little that is useful (short of getting people to think about this) and a lot that is damaging (reporting their results sloppily and failing to see the big picture).
And really it is time the media DID read research studies and not just sloppy conclusion sections to make up sensationalist headlines…
In the meantime, we can trust Jon Barron to flesh out the truth, or at least the best possible explanation, for these sensationalist health-related headlines
I really enjoy Jon’s
I really enjoy Jon’s clarifications..
As a point of view my mother , grandmother and her sisters all had breast cancer. My friend’s mother died of breast cancer.. She was very healthy, lived on organic foods, good lifestyle, yet still succumbed. Another woman in her 40s died of cancer… again very health conscious, eating well, excercising, living a perfect lifestyle..
Then there are people who live on junk food, do not excercise, smoke and live to 100…good genetics I guess! I think a lot has to do with the mental outlook of people. Those who really enjoy their lives seem to do far better than those that don’t and healthy choices do not seem to come into it…
Thanks Jon.
Thanks Jon.
Why do cancer clusters exist? I don’t believe in bad luck after all.
Of course, researchers don’t take into account mental, spiritual outlook and prevalent toxins in environment. It probably doesn’t exist to them, but all this surely affects cancer risk. There must be a trigger for the mutation to start with.